
CAMEL #4 (part one)
What's going on in the market?? and a video with Allan Schwartzman
Hi,
Welcome to the first part of the fourth letter of Camel, my newsletter covering a variety of art-related and Grant-Tyler-related topics. As the season kicks off, there have been a number of openings and a lot of news since the last issue. For this month, I question the continuing doom and gloom narrative in market coverage (featuring the results of my newfound neurosis generating graphs with ChatGPT), I review a handful of the shows that have opened in the past month or so in LA, and I share some shows in other places I’d like to see if I could. And since people liked the Hilton Kramer video from last month’s issue, I included another favorite, Allan Schwartzman talking about the formation of the Contemporary Art market. I unfortunately overshot size limitations again so will be splitting this month’s issue into two parts. Part one includes my market research and a video, and part two features reviews and recommendations and a news digest.
I hope you enjoy it. I deeply value the feedback of my readers and hope that Camel can help spark conversations about what we can do differently as artists, dealers, writers, etc to support an improved artistic environment. Don’t hesitate to comment, message, or join the chat.
MARKET
Doom and Gloom? There’s been a lot about the art market’s suffering these past couple years, and that accelerated a bit this summer. But does it add up to catastrophe? I want to try to get past the feeling in the air and take a stab at the hard data. What do we know about the art market’s performance historically and how does that inform our current position? What is the nature of the supply and demand imbalance that’s broadly shifted the situation into a buyer’s market since 2022? Does the data suggest there is an end to the hardship coming?
ArtNet published their mid-year intelligence report a couple weeks ago. From that, an article by Katya Kazakina titled The Storm Hits the Art Market has been making the rounds. Kazakina makes the case that the art world is in a state of “precariousness” due to underwhelming sales and overwhelming overheads, and cites Clearing’s closure as a case and point. She adds in other recent closures like Blum, Venus over Manhattan, and the Kasmin restructuring as further evidence of industry-wide turmoil.
Just to take a moment and focus on LA: Tanya Bonakdar will close its LA gallery after 7 years, the legendary LA Louvre in Venice announced its closure after 50 years, moving to pop-ups and private dealing. In 2024, the Reena Spaulings/Gaga collaborative LA gallery closed; Hannah Hoffman in LA sidestepped the worst of this downturn when she closed her bigger space opting for a leaner more targeted strategy of two small outposts (one in the saturated new “Melrose Hill” area, the other meeting collectors where they’re at in Beverly Hills [in a further move of strategic restructuring, this past week Hoffman announced a merger with Bridget Donahue]; Carlye Packer walked away from her space in Silverlake to focus on pop-ups and private dealing; shortly after an elaborate expansion and remodel, Smart Objects went on hiatus in March 2024, returning with two shows earlier this year, but since suspending operations once again; and Harper’s, Gavlak, and Half gallery all ceased LA operations. But it’s not just an LA thing.
Kazakina’s second header of her article asserts, quoting the owner of an art supply store, that we are witnessing “an industry in freefall,” and brings it home quoting collector and talking head Alain Servais saying “blood will flow in the streets before the art market finds a new balance.” Would I characterize the present state of the art market as precarious? Probably. Would I characterize it as a bloodbath in freefall? No. ARTnews published a rebuttle by Daniel Cassady suggesting that such apocalyptic reporting is partly the result of struggling art media outlets looking for clicks, and partly the result of a younger generation who feels locked out of real participation in the art world cheerleading collapse as an opportunity to find their entry.
Kenny Schacter is quoted in Cassady’s article saying “the art market is fucking fine today, yesterday, 1,000 years ago and 1,000 years from now,” and roughly defends the point in his new ArtNet article. The truth is probably much less dramatic than both of these extremes. Overall, the market is obviously hitting a slump and is looking for new strategies. That goes for primary and secondary, for galleries, for fairs, for public institutions, for auction houses, for art supply stores. That goes for “ultra-contemporary”, Contemporary Art, Post-War, and so on (interestingly, in a signal of risk-off attitudes, Old Masters seem to be having a bit of a boost this year [and Rembrandt’s getting tokenized]). The question that lies at the heart of this for me is whether this is a cyclical market correction or an indication of fundamental structural issues. Many say that there are too many artists, too many galleries, too many fairs, too high prices, and not enough collectors. This is a cyclical view of the downturn, because it suggests that the market’s supply is oversaturated and needs to cool off in order to find equilibrium with the less saturated demand side of the equation. Let’s first explore this proposition, later we’ll explore what it would mean if it were structural.
A cyclical market correction would mean that in the wake of the pandemic, as the art market heated back up, it overshot its real value, and is now trending back down, looking for equilibrium. After the pandemic, there was a boom, and the character of that boom was largely speculative. A fresh MFA grad’s work might’ve sold for four digits in 2021, for five digits in 2022 on the primary market, and 7 digits on the secondary in the same year.
The after declining ~20% (all YoY changes measured in inflation-adjusted terms) to $50.1 billion in sales volume in 2020, the market recovered a similar ~20% to $67.8 billion in 2022. For context, the art market crashed 35% to ~$39.5B in 2009, but rebounded roughly 56% over two years to ~$64.6B in 2011. In both cases I’m measuring from the pre-crisis year to the low of each crisis (2009 and 2020 respectively) to the subsequent high before a pullback (2011 and 2022 respectively). When adjusted for inflation, the post-2008 rebound was more than twice as strong as the post-pandemic one.
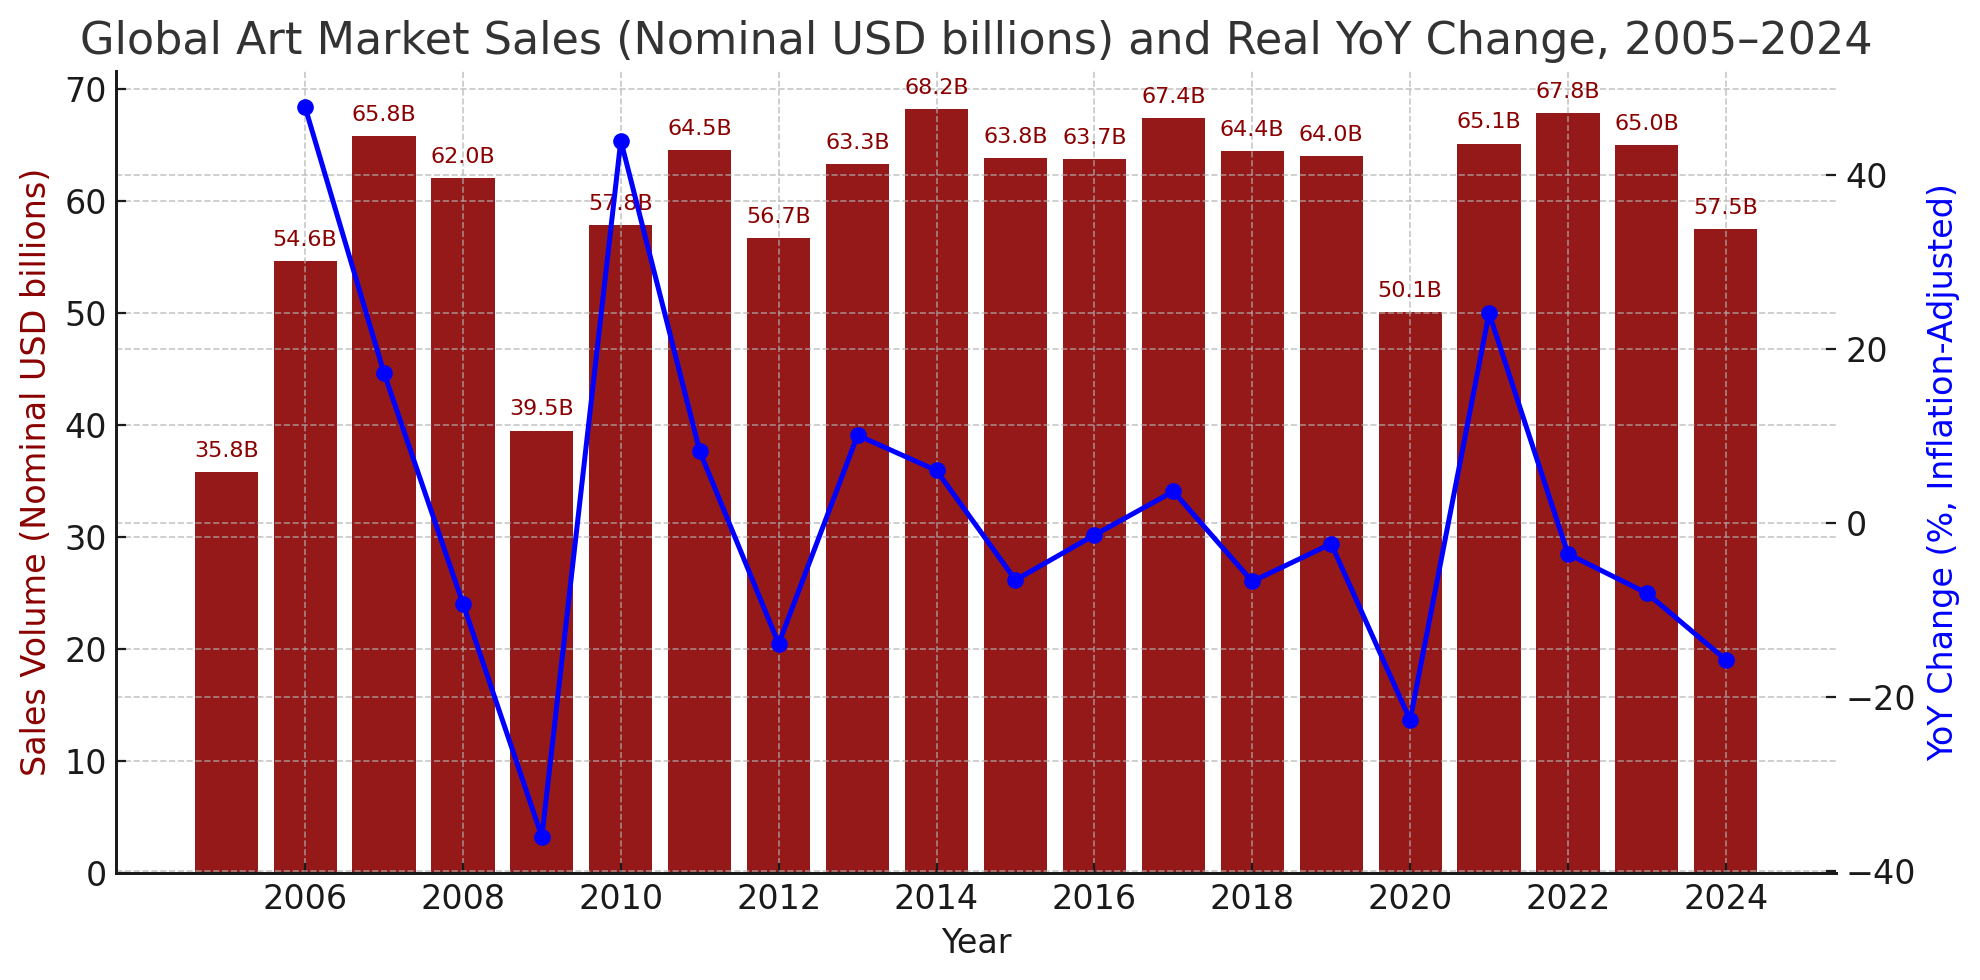
Measure the pullback from these post-crisis rebounds to their subsequent lows, which we can think of as corrective behavior, and we see that from 2011’s $64.5B the market shrunk –13.9% to $56.7B in 2012 before moving back into growth in 2013. From 2022’s $67.5B the market has shrunk –21.1% to $57.5B in 2024. Indications are that we will see sales volume continue to decline in 2025’s numbers once they are reported. In sum, while 2008-2009 saw steeper crisis-initiated declines than the pandemic, that moment’s subsequent rebound far outperformed the post-pandemic era, and the ensuing corrections from there on were much softer.
What does this mean? Honing in on these crises, I am looking for the response behavior from the market as an indication of its overall confidence. Because the art market is a luxury market supported by the availability of excess wealth, its cycles are largely determined by downside pressure of external financial crises and the upside pressure of profitable macro-environments combined with the art market’s systems of pricing and distribution. External financial crises are driven by dynamics like the long and short debt cycles (1990s, 2008) and extra-financial crises like the pandemic. Meanwhile the upside pressure of the art market derives, like any industry, from the competition of the overall art market. It is designed to make the whole thing grow: galleries grow in scale, artists grow their prices, auction houses seek more for their lots, and so on. And as long as there are willing buyers (which again are formed by favorable macro-economic conditions), this growth should materialize. But, when a crisis hits the global economy and macro-conditions turn sour, the art market suffers as a matter of effect, and is checked into lower levels. From there it tries to trim the fat and hold on until macro-conditions improve.
But what actually happened when the broader economic conditions improved following these crises? Do we see a return of those surplus financial resources to the art market? By comparing the ripples of the 2008 crisis to the 2020 crisis we can see that the art market bounced back much more aggressively following the 2008 crisis than after the 2020 pandemic (that’s the 56% figure from 2009-2011 compared to the 20% figure from 2020-2022 mentioned earlier). That could be due in part to other sour macro conditions that crept in as the pandemic situation eased, but more on that later.
Once the exuberance of the post-crisis rally cooled, how deeply did a correction set in? It is natural for the bounce-back rallies to contain some amount of real value, and some amount of hot air. What is the ratio of value to hot air in each of these recoveries? One way to begin to understand that is by observing the degree to which things subsequently fell after the momentum of the rally eased. Again we can see that the art market fared better in the wake of 2008 than it did in the wake of 2020 (in 2012 the market shrunk 13.9% from 2011 highs while in 2024 the market shrunk 21.2% from 2022’s highs. So despite only rebounding by slightly more than half as strongly as it did in 2008, still, today’s market fell back even further, and is presumably continuing to fall. On top of a weaker recovery than 2009–2011, today’s market has been correcting more severely — an asymmetry that points toward deeper strain.
But, as mentioned, there are other considerations at play. Today’s world is different from the post-2008 world. We have the cascading effects of geopolitical tensions and conflicts; broad and significant renegotiations of trade relationships; political, social, and economic realignments; and so on. Everywhere since 2008 — but especially since 2016 and 2020 — things are changing in a deep way. If it looks like rain and it smells like rain, it’s probably gonna rain. Certainly these non-pandemic-related global uncertainties are causing collectors to consider whether they’d be better off holding onto their cash for that rainy day, adding drag to the luxury market for fine art.
I want add a caveat that, so far, this has been a very broad view, focused solely on the total global market sales volume, and thus is inherently limited and does not tell the whole story. But it does provide some grounding for evaluating whether what we are experiencing is simply cyclical or whether there are symptoms of deeper “structural” issue.
So what would it look like if the downturn is structural? That would mean that the structures (the galleries, auction houses, public institutions, etc) are mismatched to the reality of their consumer. Since the early 80s, the Contemporary Art market has been impressively growing, albeit with some of those cyclical ups and downs. How would that development of the supply and demand sides of the market grow to become disproportionate? First thing to establish is that we don’t have a supply issue — that is, not an under-supply issue, not quantitatively. There are more galleries, fairs, and artists than ever. There is more than enough art to go around. It doesn’t take much to demonstrate that. So then is there a demand issue? We will come back to this. But first, what if is there a qualitative supply issue? What if the problem is not that there’s too much art going around, but that buyers have less faith in the art that’s going around — both in market terms and in emotional or ideological terms. The art market is ultimately all about soft factors like taste, vibe, influence and style that are not chartable but hugely consequential to the numbers. This kind of thing could be very consequential when looked at through a generational lens, but I’ll save that for another day.
Let’s start with what’s chartable. Historically, the performance of the art market is connected to a few factors: GDP, equity performance, and global interest rates and liquidity. Each of these relate primarily to the demand side of the equation because they point towards wealth creation and the available cash that could be buying art. I’ve charted a few of these below.
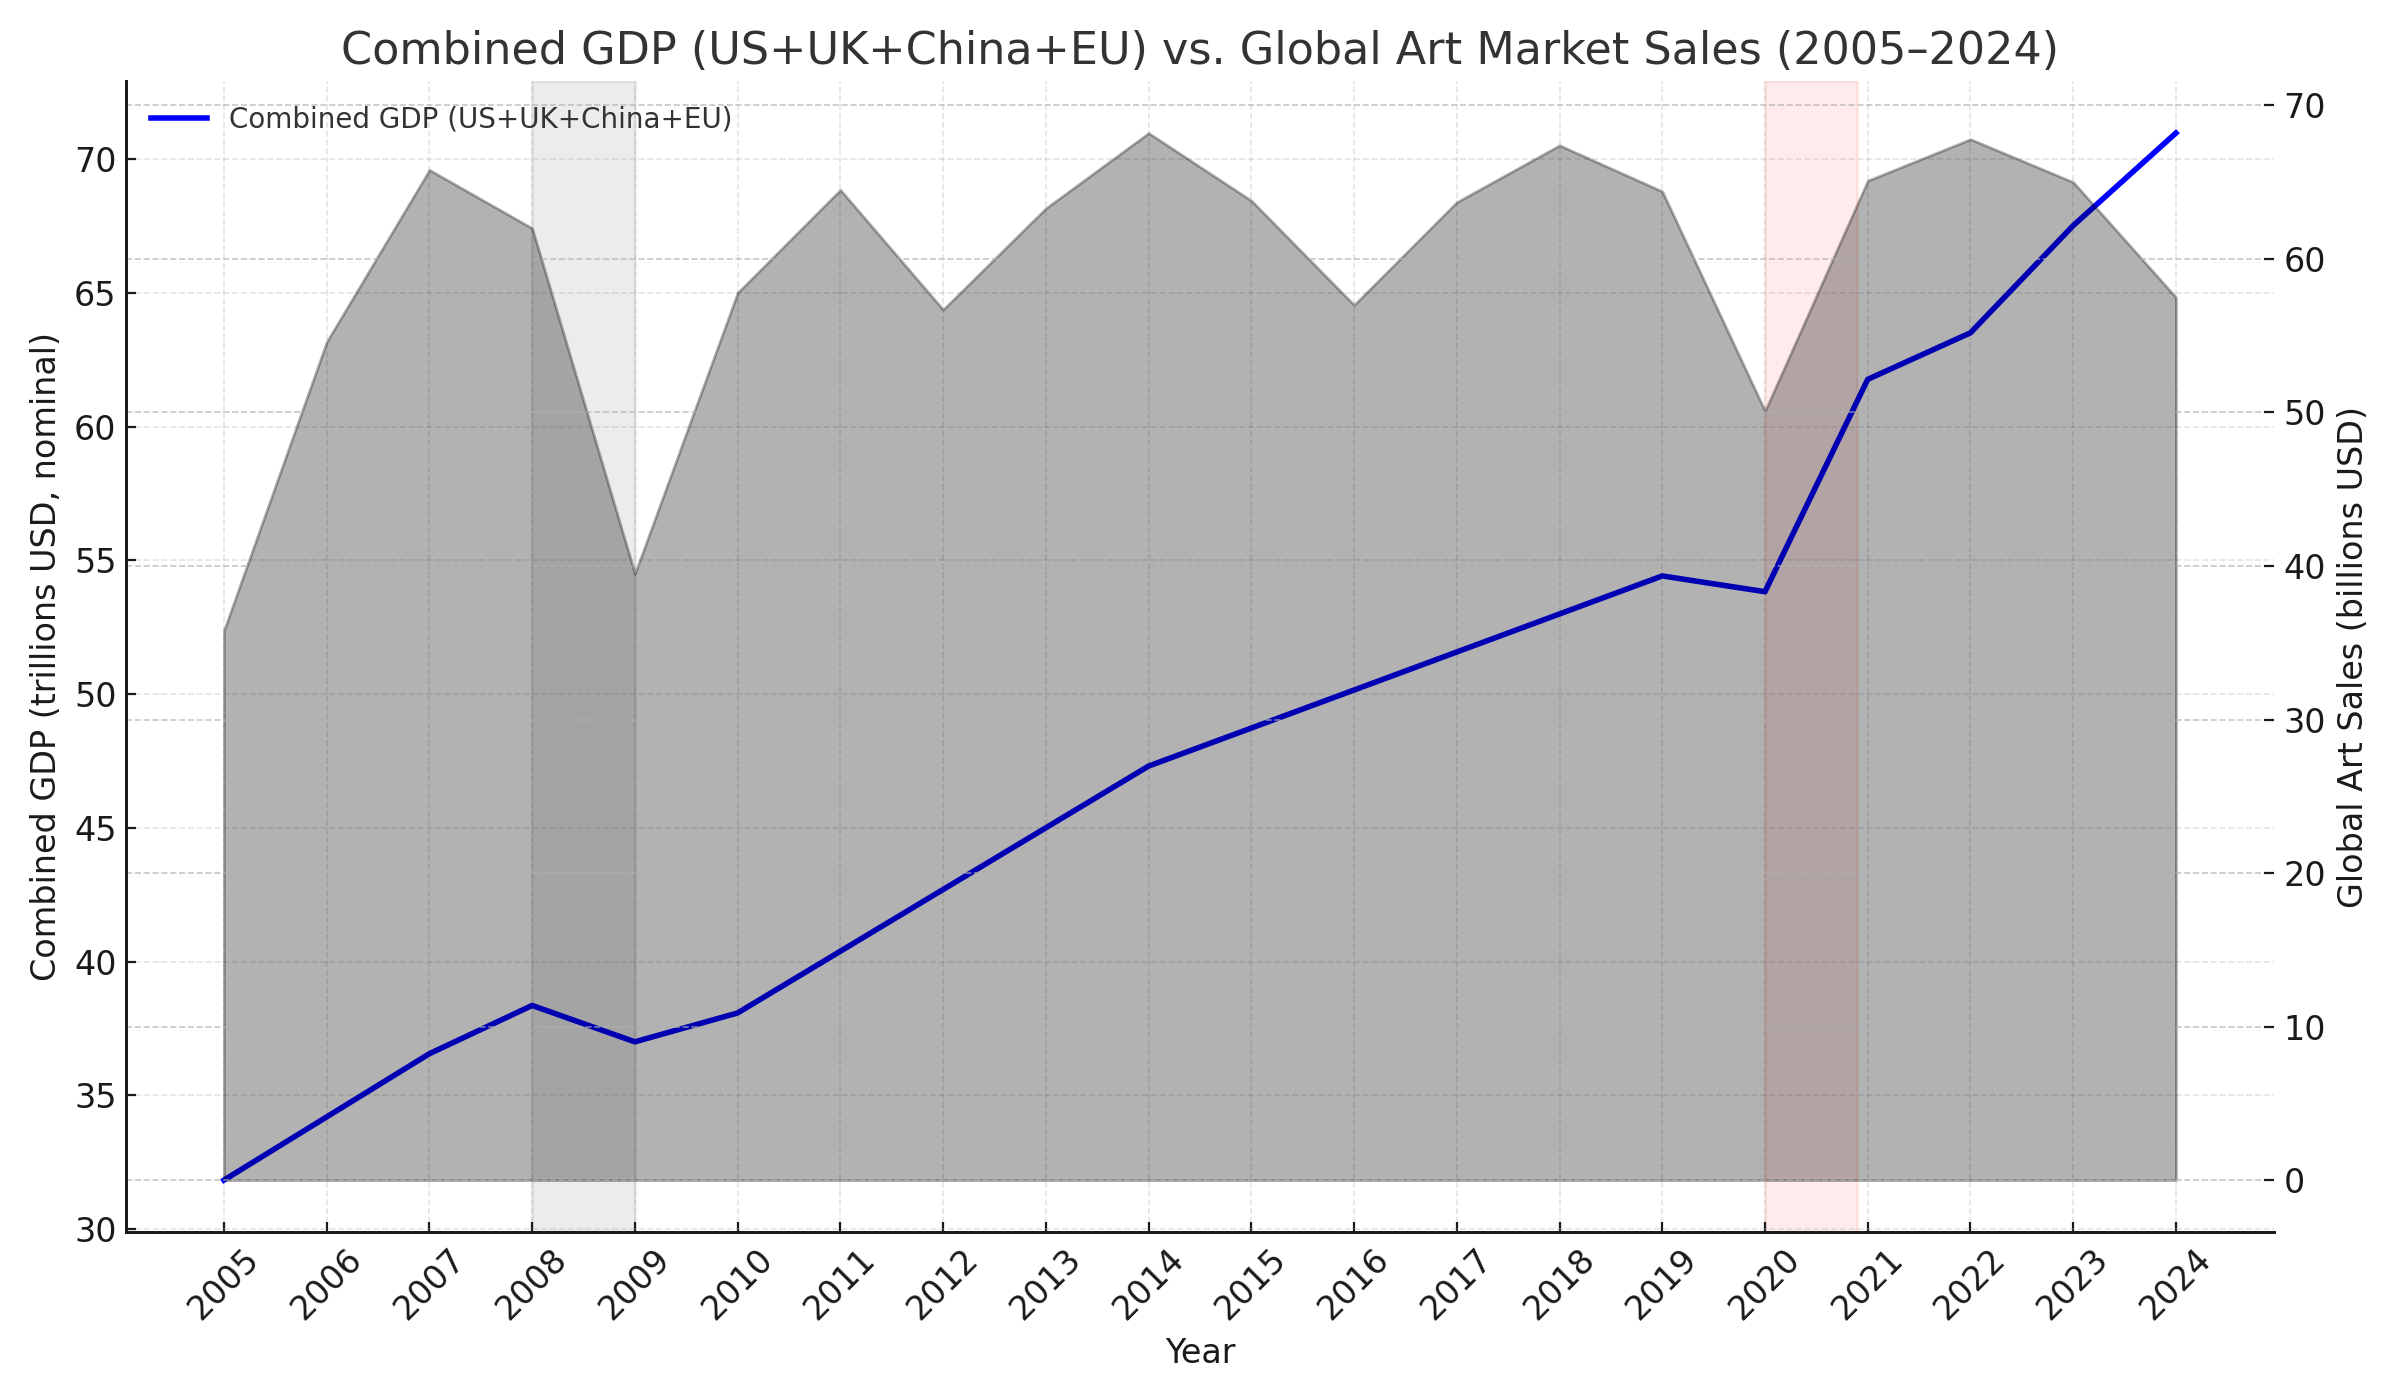
First is a chart plotting global art sales volume against the summed GDPs of US, UK, China, and EU, which together account for roughly 90% of the art market. Throughout this analysis I stuck to these four regions for the sake of simplification. Scanning from left to right, we see general correlation between summed GDP and art market sales volume, especially during the years 2005-2011 and 2019-2022. In the period between crises, we see that correlation begin to loosen. Starting in 2012, as GDP continued to rise steadily, we see sales volume take a dip. After a year this reverts to a correlation, but in 2015 it occurs again. These are cyclical periods of growth and decline in plain view, unobstructed by the disturbances of massive external crises like the Recession or the pandemic.
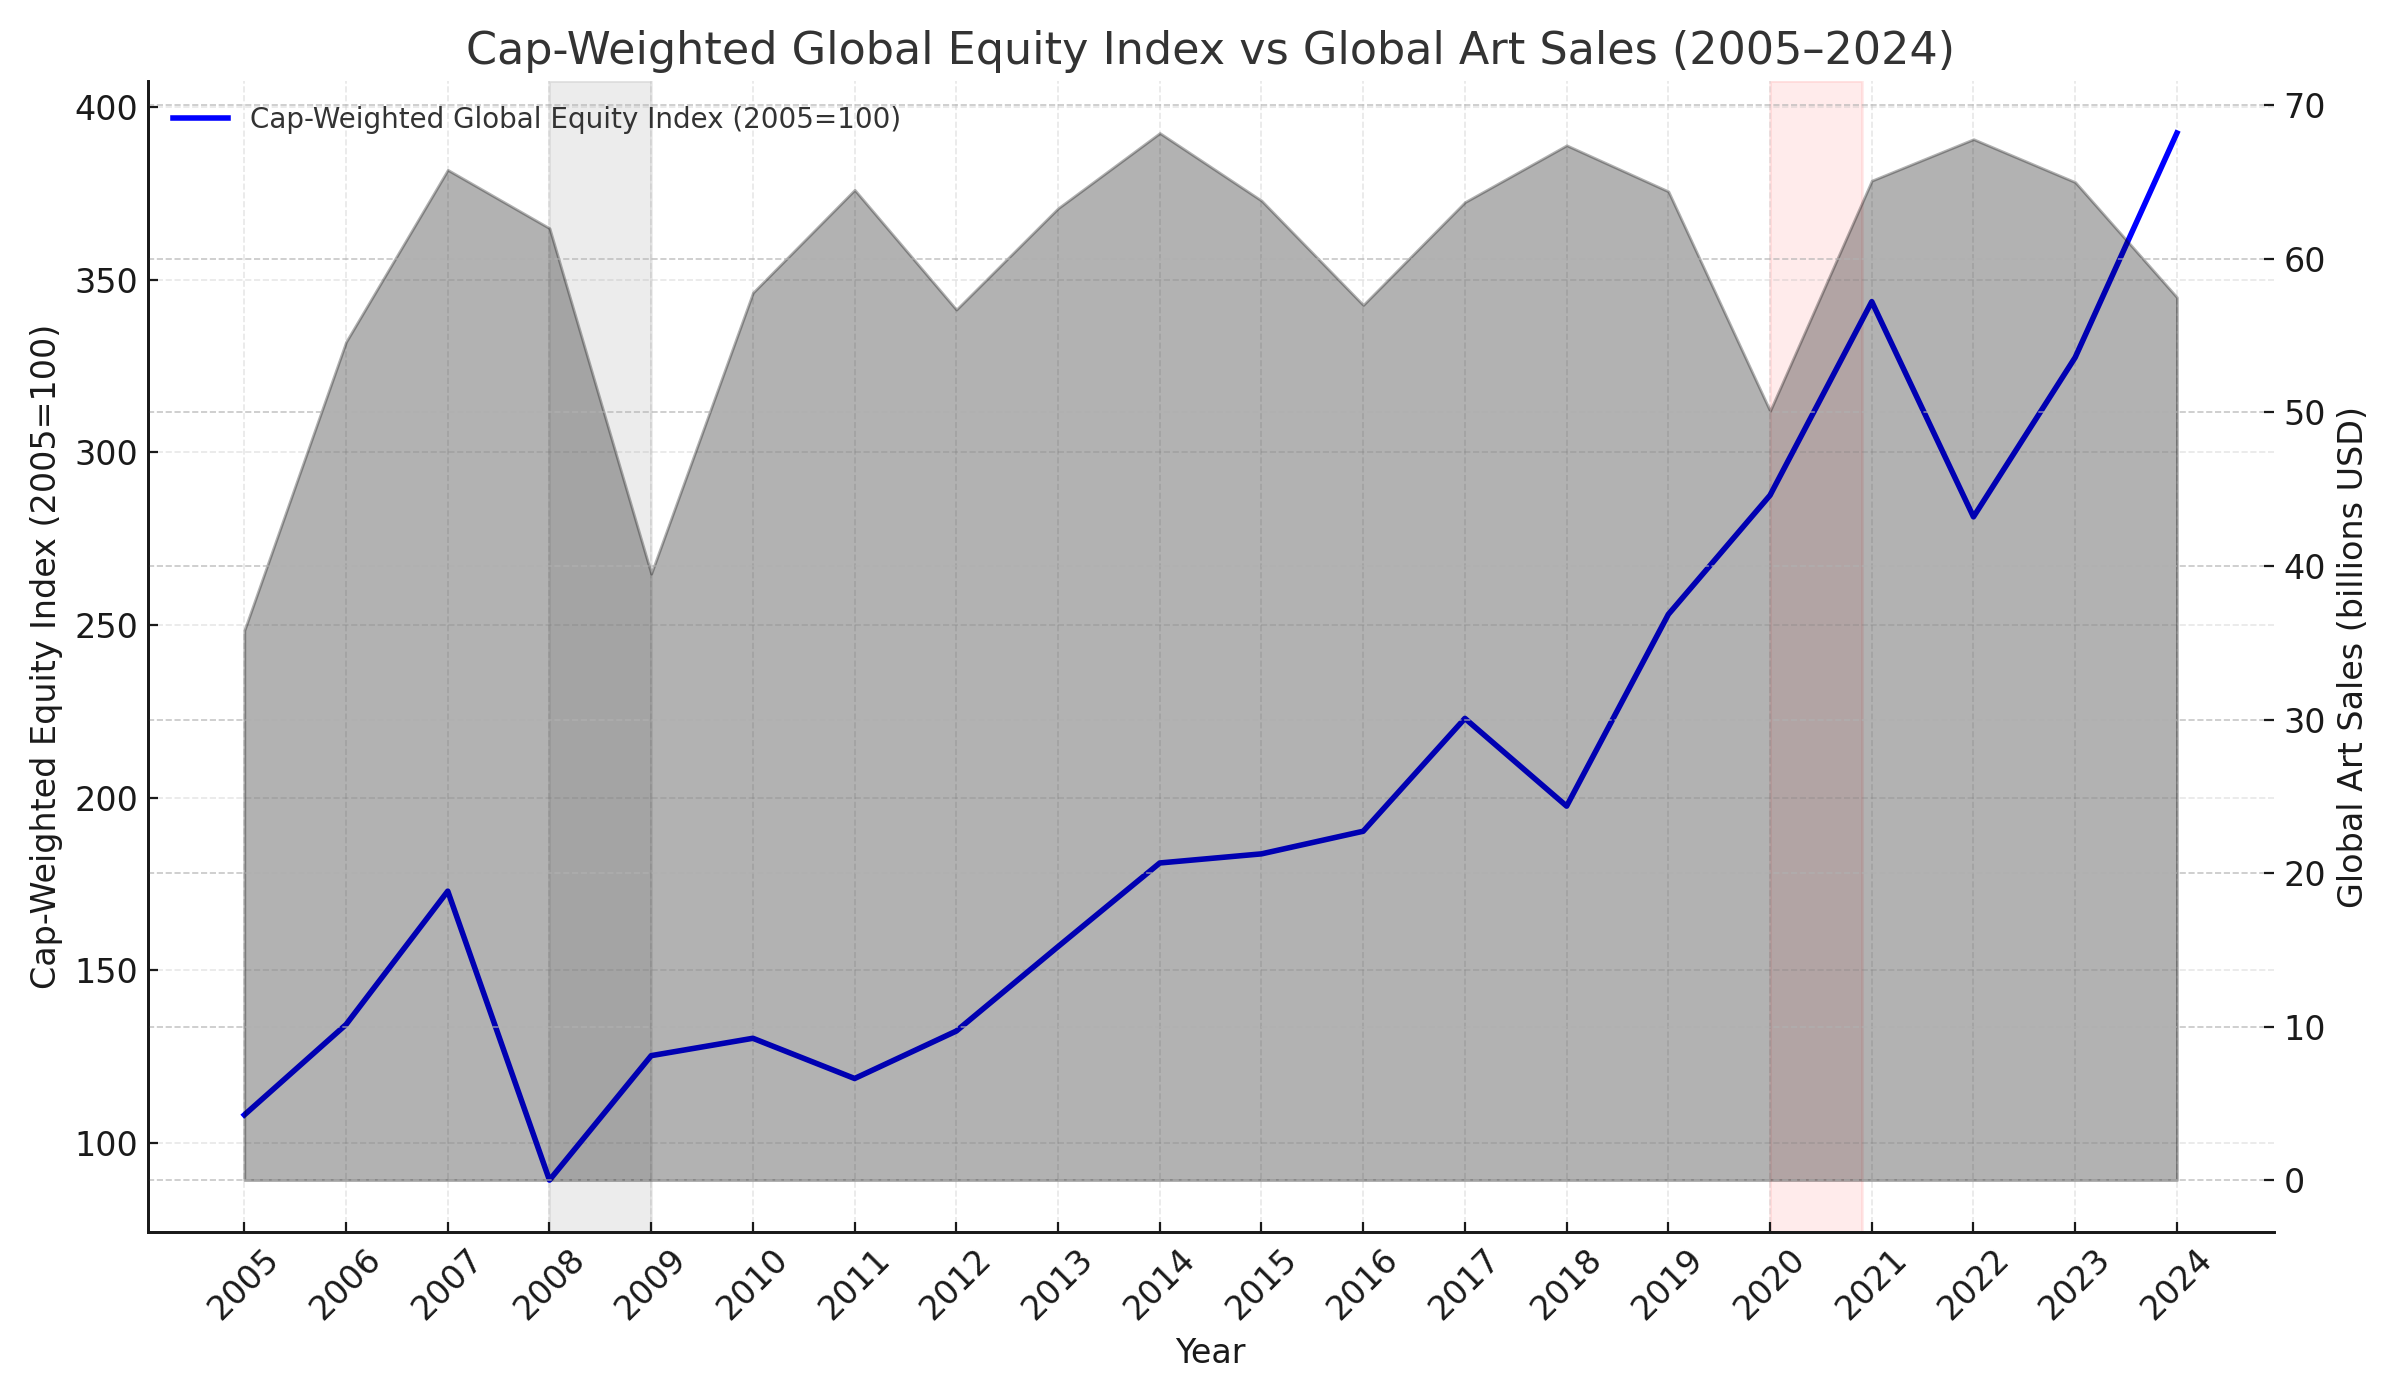
Looking now at combined weighted equity indices for these same regions against global art sales volume, there is a clue to what we saw above — the art market tends to track equities with a lag of roughly a year, and this offset correlation holds during the inter-crisis period. The combined indices plunge in 2008, with the corresponding decline in art sales appearing in 2009, and the recovery plays out in the same staggered way through 2010–2011. A similar pattern shows up around 2018/2019. Still, it’s worth noting that this may not be a strict causal link — major estate sales, taste cycles, and geographic demand shifts can create large swings in turnover that have little to do with stock performance. But the most recent divergence is striking: equities recovered in 2023 and even harder in 2024, yet art sales continued to fall in 2024, which could signal more than just a delayed reaction.
This kind of technical analysis is helpful, but only in a limited way. It is not enough data to say with certainty that there is a lagging correlation between global stock markets and art sales or that it has definitively been broken as of 2024/5. This chart seems to suggest that 2025 should see a strong recovery in the art market, but that does not line up very well with our previous observations and general hunch — but it could be the case. If we go back to the chart comparing combined GDPs with art sales, we see the apparent correlation breakdown at the same place. There could be another factor to explain this.
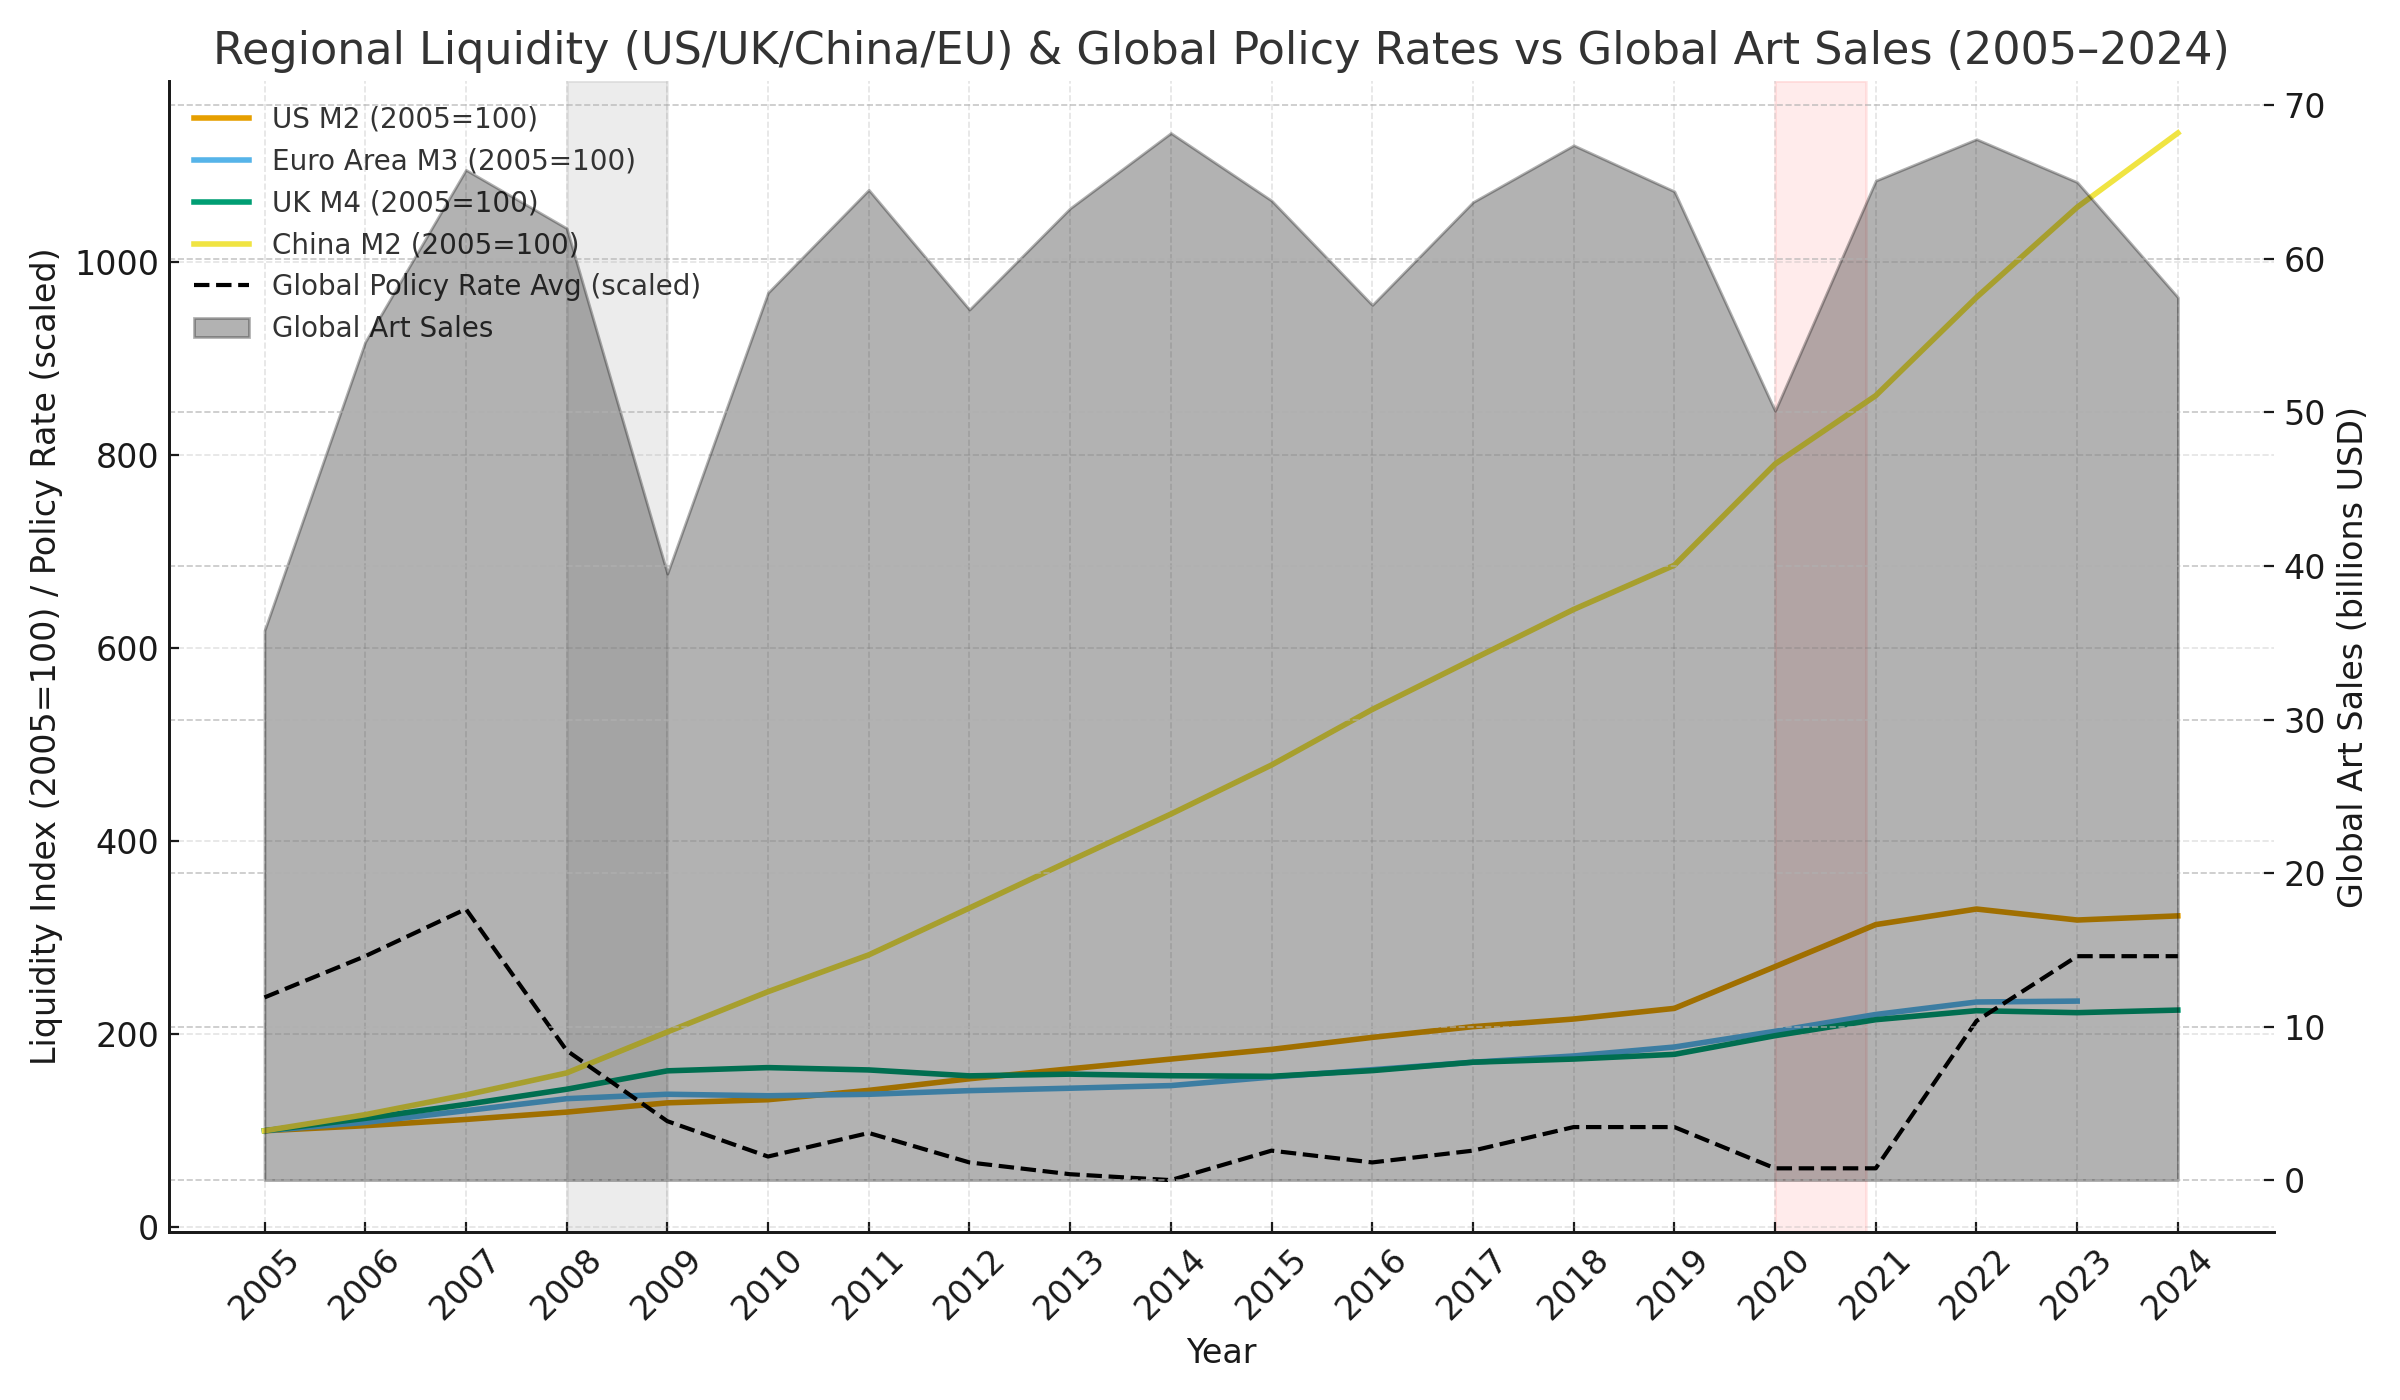
The above chart compares global interest rates and regional liquidity against art sales since 2005. This seeks to illustrate the relationship between available capital in the global economic system and sales of art. Here we can see global central banks cutting rates to try to cope with crisis in 2008 and in 2020, which correlates to declines in art sales. This is because art is a luxury, and isn’t usually bought on loans from banks. If banks are trying to get loans out there for cheap, its because there’s a problem with liquidity that threatens production, growth and profits. It’s that threat that separately causes declines in art sales. For a couple years now we’ve been in a relatively expensive interest environment. When the Fed and other central banks began raising interest rates in 2021, they were trying to put a cap on all the inflation that came from juicing the system with liquidity during the pandemic. But this raise in the cost of borrowing slows growth, slows production, and causes profits and excess income to slow, stall or decline. Hence we see the art market start to peel back. So in 2021 when GDP, which is the measure of the value a country’s output in products was rising, and the speculative value of the producers producing that output (equities) was rising, banks started to hike rates to keep inflation from getting out of hand. That’s why we see a drag on GDP and a drop in equities in 2022. This could result in smaller amounts excess free cash floating around for luxury goods like art. But by 2023 GDP and equities show that they have dusted off some of the pressure of high rates and begin to climb more aggressively. Last week the Fed in the US started cutting rates finally, and is expected to cut two more times before the end of the year. This will lead to additional liquidity in the US which could help relieve the drag on the art market worldwide since the US accounts for over 40% of the global art market. By the way, while the US and Western countries were hiking rates in 2022, China was actually cutting, and Japan was holding them low. This explains some of the Asia rush we saw in recent years.
We are looking at these charts to try to determine whether the current art market is dealing with a problem of demand (not enough willing and able buyers [cash problem]), or a qualitative problem of supply (maybe there are buyers/cash out there, but what’s for sale is not interesting to them). In two of these three areas we have seen quantitative reason for increased demand from 2022-2024: productive value growth (GDP) and speculative value growth (equities). Liquidity has been mixed regionally, stronger in Asia, weaker in the west, due to a comparatively high-interest environment here. There is room for this to account for the present slump, but as we approach the end of 2025 and art sales still seem to be lagging, other industries have not faced the same austerity. There is one last data point I want to include before I make any suggestions about what all this reveals, and that is to chart art sales as a portion of personal luxury goods. This will help clarify whether luxury spending overall has declined (indicative of cautious financial attitudes or a lack of cash), or whether the art market is disproportionately experiencing demand disinterest.
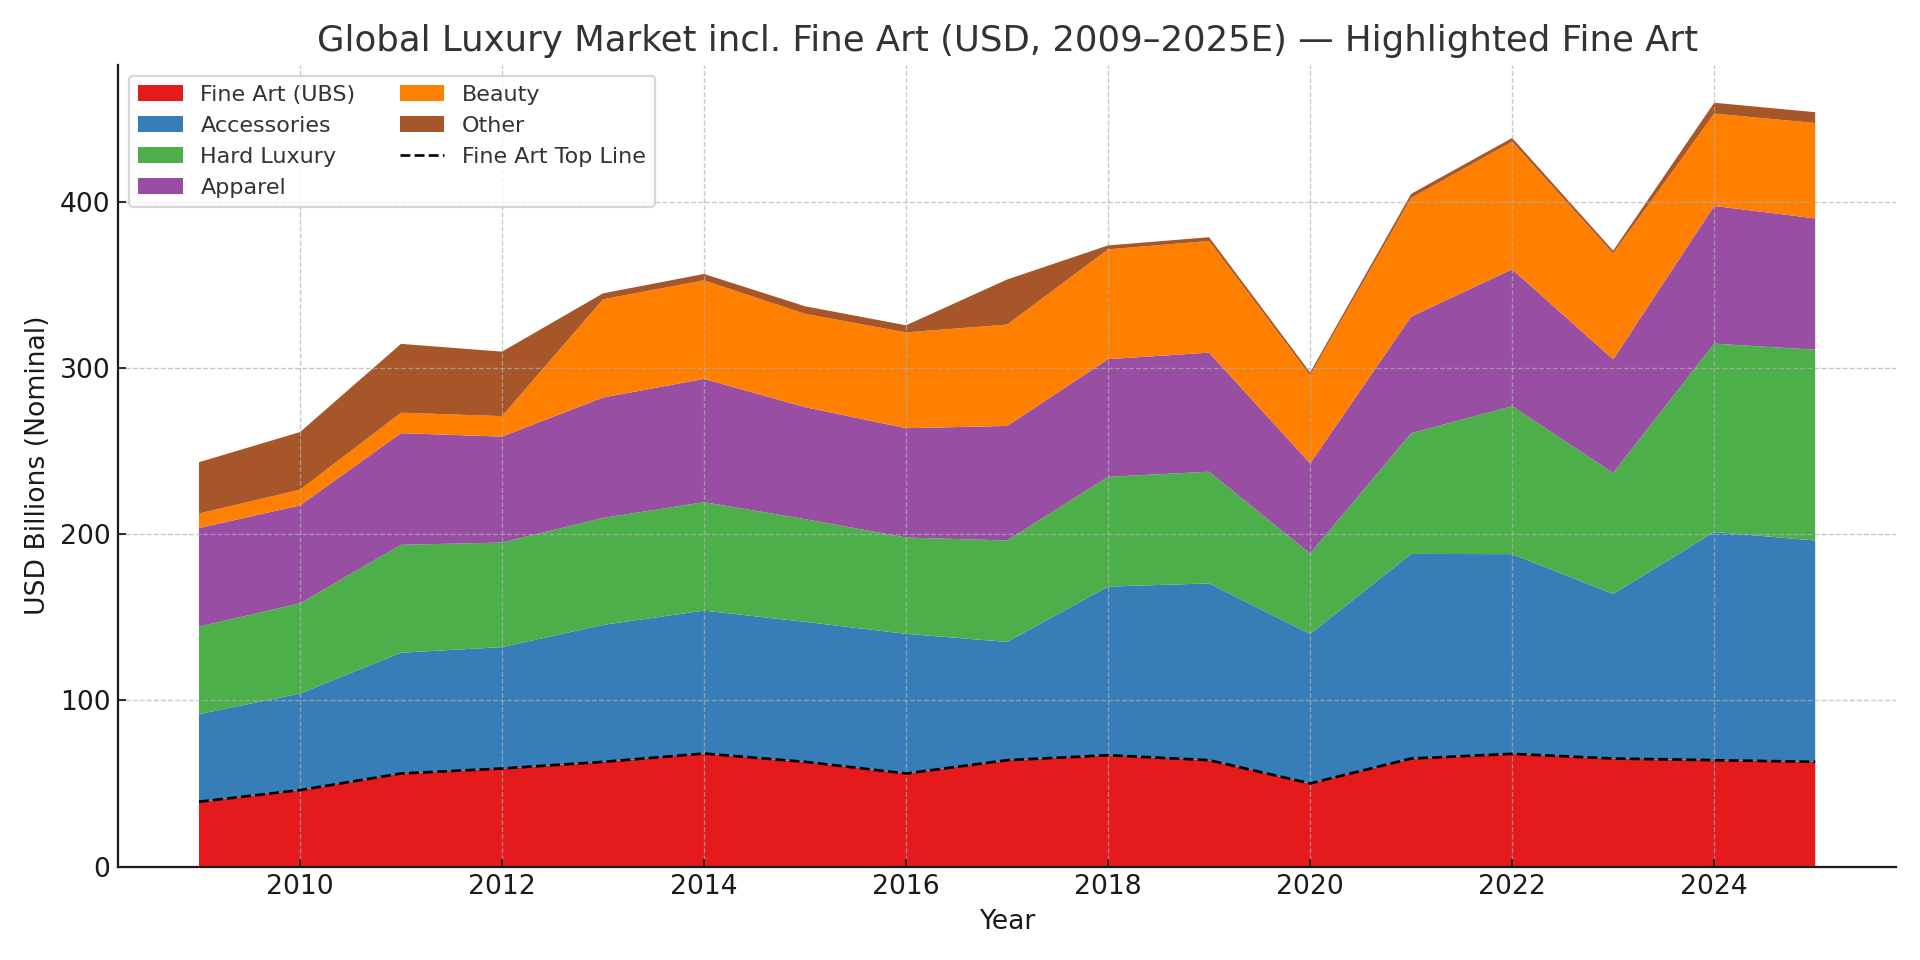
Here’s a layer chart showing the total personal luxury sales volume between 2009 and 2025. (I would’ve loved to have kept our 2005 starting date but luxury goods data from pre-2009 was not easy to scrape. If I find a way around this I’ll republish later.) For our purposes this is good enough. Note that because the total volume of luxury sales is much higher, the appearance of the art market data is somewhat squished, even though the data is consistent. Further, this shows the significant stability of the art market in sales terms when compared to the volatility of personal luxury sectors. Given more time it would be essential to compare also against an expanded luxury category that included markets like wine and spirits, luxury and collectible cars, yachts, private jets, luxury hospitality and so on.
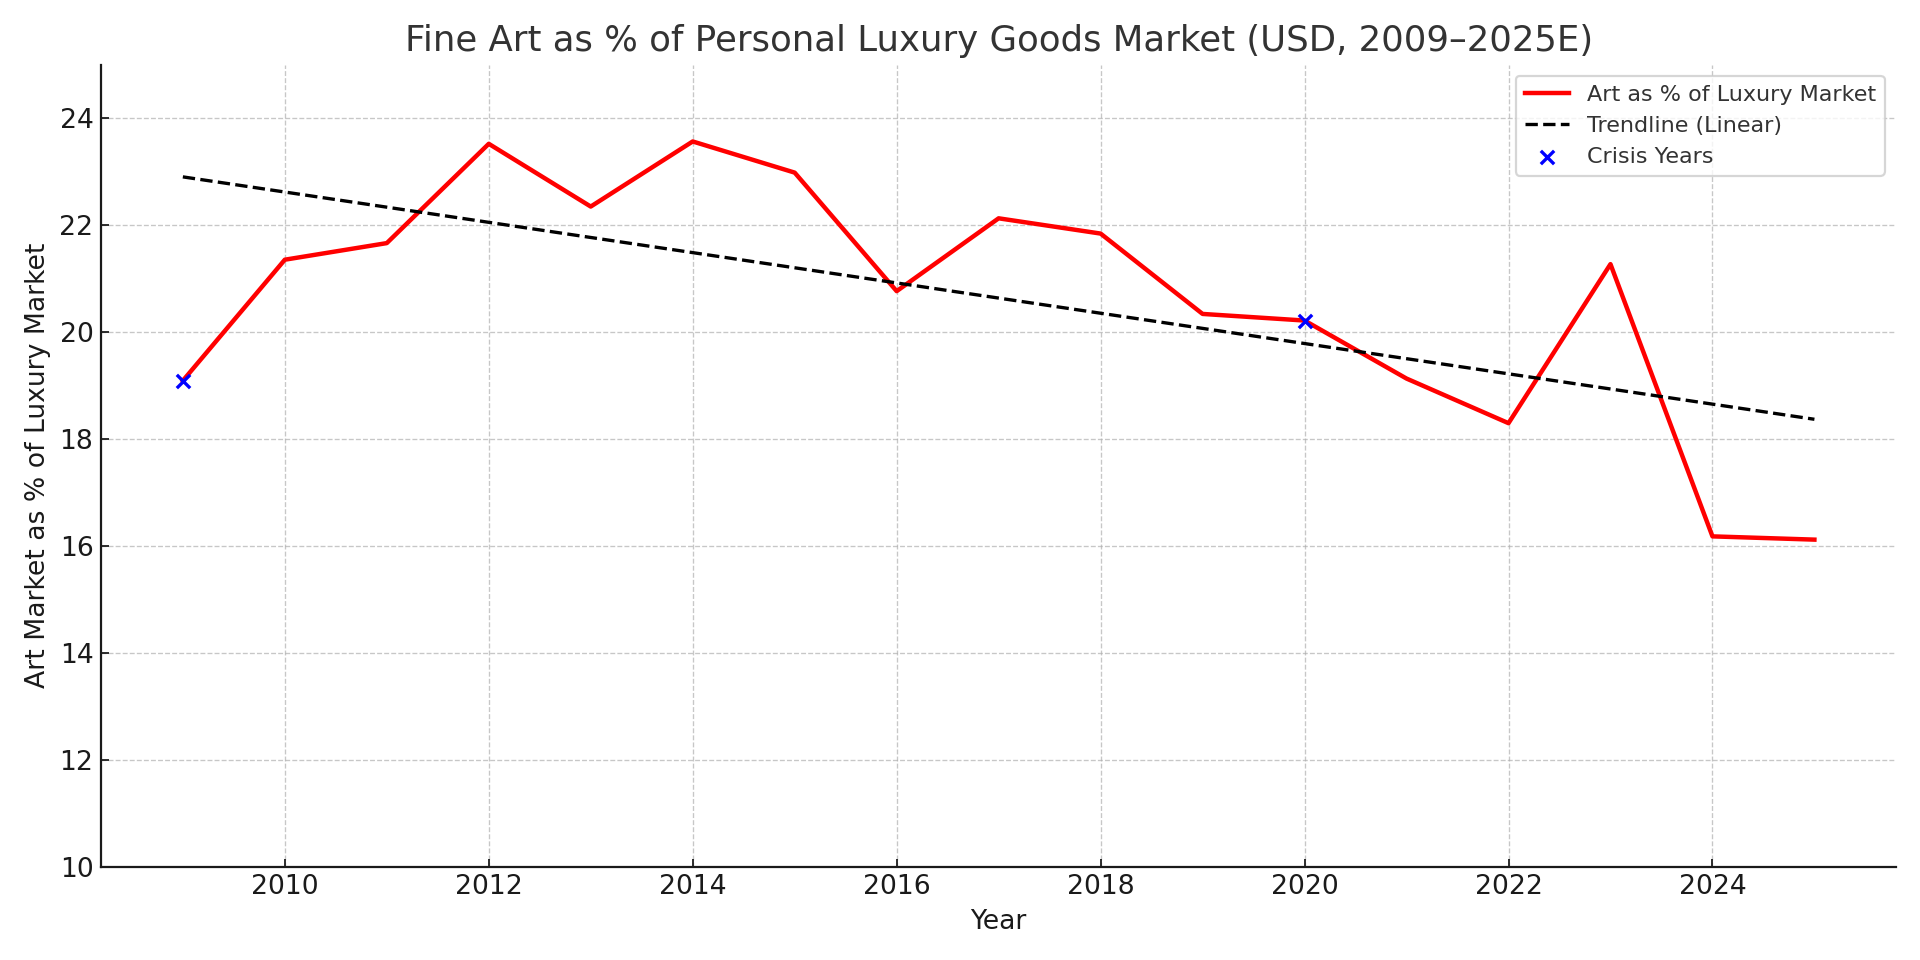
This chart takes that same data but hones in on art sales as a percentage of the global personal luxury goods market. I’ve added an averaged trendline to underscore the point. The spikes such as in 2014 and 2023 don’t necessarily represent growth in the art market, but the volatile declines in spending in other luxury sectors.
Since at least 2009, we’ve seen a relatively steady decline of art as a percentage of personal luxury spending. For hard numbers: spending on luxury goods excluding art grew about +74% in nominal USD between 2009 and 2024. By comparison, art sales grew only about +10% over the same period. In other words, after stripping out inflation, personal luxury spending outside of art has grown almost four times faster than the art market over the past 15 years. There are a two key reasons why this could be exaggerated: one we are using (due to limited resources) personal luxury goods data which are at a far lower price point than fine art and thus represent a broader spectrum of clientele; and two, we have established that personal luxury goods undergo far greater volatility than fine art sales, so we could assume that our data set begins with luxury goods suffering a deeper contraction in the wake of the 2008 crisis, allowing it greater room to expand. Nonetheless, short of a broader comparison with higher ticket luxury goods, we see a significant general shift in luxury spending away from fine art.
So are people still spending excess cash on luxury goods? It looks like yes, but they are doing so less and less within the art market. This doesn’t conclusively explain the de-correlation of art sales with positive macro-metrics like GDP and equities observed earlier. It doesn’t prove that the apparent de-correlation will continue. But it does start to suggest that the issue with sales in the art market isn’t only a demand issue, but a qualitative supply issue. The art industry, the “structures”, are failing to provide what the demand wants. In short, art is failing to maintain its attractiveness as an outlet for luxury spending. This is the root cause. The closures and restructurings, the embarrassing auction results, and the journalistic panic are the symptoms. Does the market still produce appealing art that finds buyers? Absolutely. And a lot of it. But it is indisputably declining. In my opinion, it doesn’t need to. But, it will continue to decline, short of a reexamination of what makes art worthwhile for everyone, collectors, artists, writers, viewers, etc — i.e. short of better art. Speculative flipping has undoubtedly spooked buyers as well, and that would be blunted if art could prove itself to be worth holding onto for a long time. We have lost the plot on art’s purpose, and we are seeing the consequences. The worst thing that could happen now (from the perspective of someone who loves art as an experience) is for the industry to try to model itself after other luxury sectors like fashion or the experience services industry. And we’re seeing some of that. This would fuel short-term speculative bubbles and drift further from fine art’s potential as a cultural heritage that defines epochs. The best thing that could happen would be to reexamine the ideological substance of Contemporary Art and cultivate a new aesthetic legacy that meets our historical moment.
I’d be the first to point out the shortcomings with this humble study. In a perfect world I would dive deeper into this data within a broader timescale encompassing the entire epoch of Contemporary Art. This would help paint a much clearer picture of the extent to which these metrics exhibited correlations historically, and to what extent we should entertain the significance of their apparent de-correlation. I’d compare more categories of luxury spending over a longer period of time. I’d attempt to chart changes in taste, regional activity, and primary/secondary sector activity with higher resolution related economic data. I would also turn to other categories including soft data like sentiment, genre trends, institutional collecting trends, parse by generational preferences, and so on. Much of this data gets exponentially harder to collect the further one goes back, and would require some longer term commitments than I am currently able to make. Maybe some other day…
VIDEO
I love this talk by Allan Schwartzman from a few years ago. He runs through a rough history of the Contemporary Art market, describing the strategies employed by dealers like Paula Cooper to cultivate a new generation of collectors in the 1970s and marry them to the works being made by students in New York at that time. This was how the Contemporary Art market was created: thoughtful dealership finding opportunities to assert the value of the artists they work with to a new demographic of customers. That’s a huge tenant of what I think we need today.
My sense is that there is sloth among the big dealers who are used to a particular client base (one that is dying out and/or softening their purchasing), and complacency down among the mid-tier and lower-tier dealers. This is not helped by the dearth of ideological insight to today’s artistic practices caused by the decline of art criticism as a practice over the last 30 or 40 years. But passivity to trends will lead to a decline in artistic quality, and I believe we’ve been seeing that since at least 2008, though one could argue it goes back deeper.
Thanks for taking the time on this! early career artist heading to participate in my first fair, Season Fair. Enjoyed reading this as a zoomed out lay of the land.